sort pixels by color
How to grab a big list of all the pixels in an image, and then do some manipulation to them (like sorting them by hue/brightness/etc). This is all in p5.js for now but I would be curious to try something like it using the native canvas API.
Load an image
let img

function preload() {
	img = loadImage(imgUrl)
}

function setup() {
	createCanvas(200, 200)
	noLoop()
}

function draw() {
	// if you just want to draw the image on the canvas:
	// image(img, 0, 0)

	// but we want to actually examine the pixels:
	img.loadPixels()
}
Now we have access to img.pixels, which is an array holding data for literally every individual pixel in the image. We're going to iterate through them, sort them somehow, and then spit them back out onto the canvas.
Tangent: How the pixels array works
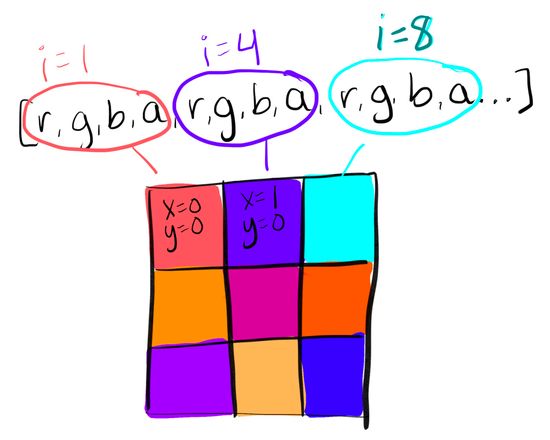
Pixels are stored as rgba colors; each pixel has a value for red, green, blue, and alpha. Meaning each pixel gets four elements in the array. If our image is 200 pixels wide and 200 pixels tall, that's 200 * 200 = 40,000 pixels. Since each pixel is actually 4 array elements, our total array length is 40,000 * 4 = 160,000.
Here's a crude illustration, if you have a tiny 3x3 image (this image has a really silly mistake, the first i should be a 0! don't mind me!):
Note that in many cases we are using retina or high density displays which have MORE pixels. The pixel density value is accessible through p5's pixelDensity() function, or in the variable window.devicePixelRatio. On my screen, pixel density is 2. That means each pixel is actually a tiny 2x2 square of pixels... so actually that 200x200 image on my screen might be represented in an array not with a length of 160,000 but 160,000 * 4 = 640,000. ANYWAY, p5 doesn't seem to factor this in when you just load the image without actually displaying it, so I'm going to mostly ignore that for now.
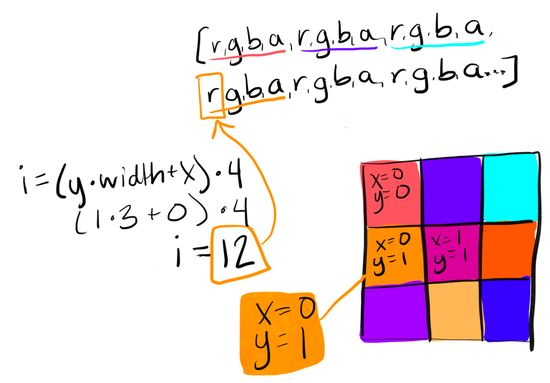
If we want to find the data for the pixel at a given point x and y, we can use the formula
i = (y * img.width + x) * 4. The variable i is just the first index where data for that pixel is held (the red value).
Loop over pixels
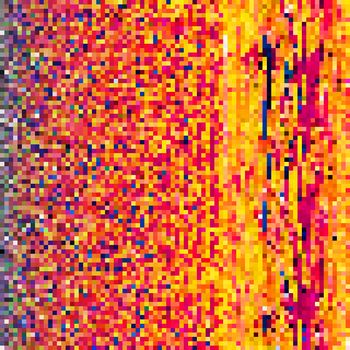
So for a demo I'm going to use this image of street art in Rio de Janeiro, from a recent trip this summer:
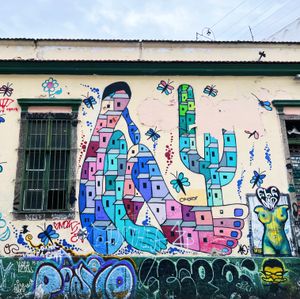
I'm using parcel to load the images and size them down a bunch, because a larger image means exponentially more pixels to cycle through which means the program gets slower & slower. I'm starting with a 400x400 image. That's still a lot of looping.
Initialize a colors array and loop through each pixel:
img.loadPixels()
let colors = []

for (let x = 0; x < img.width; x++) {
	for (let y = 0; y < img.height; y++) {
		let i = (y * img.width + x) * 4
		let c = color(img.pixels[i], img.pixels[i + 1], img.pixels[i + 2], img.pixels[i + 3])
		colors.push(c)
	}
}
sort pixels & draw them on the canvas
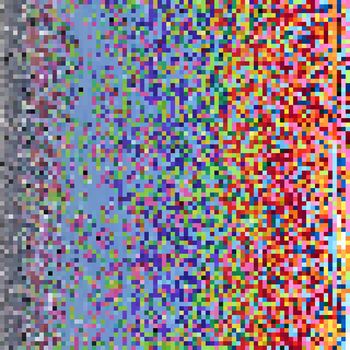
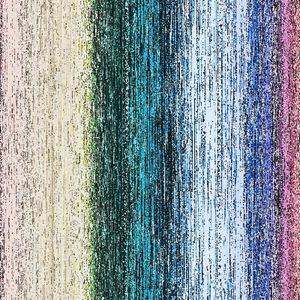
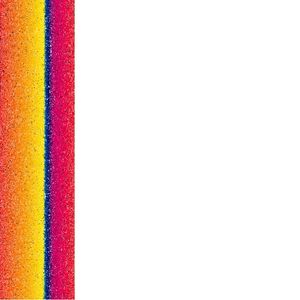
Use native array.sort() to sort the colors. For now we're going to sort by hue, using p5's hue().
colors.sort((a, b) => hue(a) - hue(b))Loop through the width & height of the image again, adding one point for each sorted pixel:
let i = 0
for (let x = 0; x < width; x++) {
	for (let y = 0; y < height; y++) {
		stroke(colors[i])
		point(x, y)
		i++
	}
}
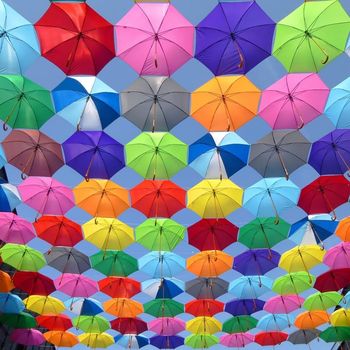
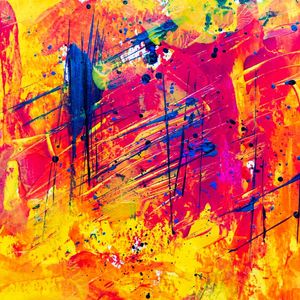
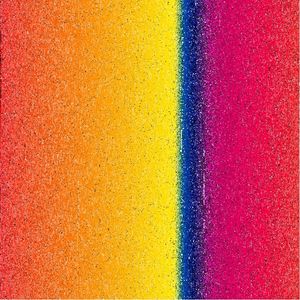
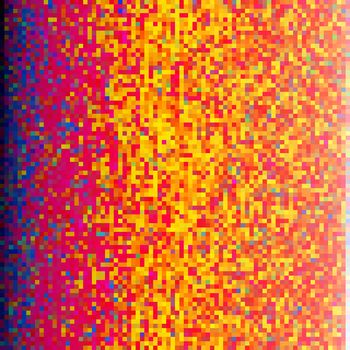
Okay... cool I guess, but maybe this would work better with an image with more bright, distinct colors. Let's try this one I just grabbed free from pexels:
skip some pixels
We probably don't need to iterate over every single pixel though... we can get the same idea from grabbing every 2 or 3 pixels.
extra tangential stuff under here
let colors = []
let step = 2

for (let x = 0; x < img.width; x += step) {
	for (let y = 0; y < img.height; y += step) {
		let i = (y * img.width + x) * 4
		let c = [img.pixels[i], img.pixels[i + 1], img.pixels[i + 2], img.pixels[i + 3]]
		colors.push(c)
	}
}

sortColors(colors, 'hue')
let i = 0
for (let x = 0; x < width; x++) {
	for (let y = 0; y < height; y++) {
		stroke(colors[i])
		point(x, y)
		i++
	}
}
Sooo that only filled a quarter of the space in the image because I didn't update the loop that actually draws the pixels. Here's another oops - stepping by the correct amount this time, but still only drawing a point at each step so that it doesn't fill the entire space.
let i = 0
for (let x = 0; x < width; x += step) {
	for (let y = 0; y < height; y += step) {
		stroke(colors[i])
		point(x, y)
		i++
	}
}
I feel like this mistake looks kinda neat though, especially if you zoom in with a darker background:
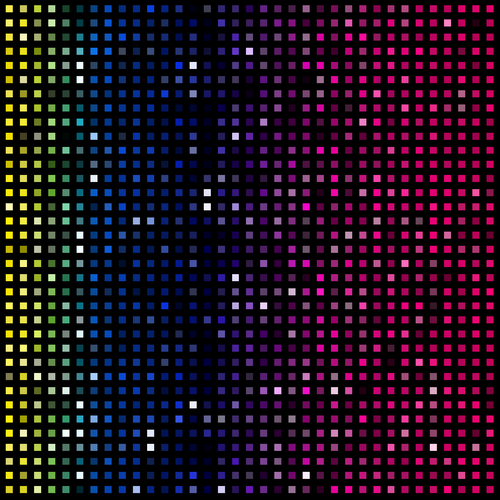
As a side note, I'm not sure why the points show up as circles when scaled up in p5 (the left image), but squares if I save the canvas and then zoom in (the right image).
let colors = []
let step = 2

for (let x = 0; x < img.width; x += step) {
	for (let y = 0; y < img.height; y += step) {
		let i = (y * img.width + x) * 4
		let c = [img.pixels[i], img.pixels[i + 1], img.pixels[i + 2], img.pixels[i + 3]]
		colors.push(c)
	}
}

sortColors()
let i = 0
for (let x = 0; x < width; x += step) {
	for (let y = 0; y < height; y += step) {
		fill(colors[i])
		rect(x, y, step, step)
		i++
	}
}
sort by different values
We can also sort by different values, which p5 makes super easy. I made a sortColors() function:
function sortColors(colors, mode) {
	switch (mode) {
		case 'hue':
			colors.sort((a, b) => hue(a) - hue(b))
			break
		case 'red':
			colors.sort((a, b) => red(a) - red(b))
			break
		case 'green':
			colors.sort((a, b) => green(a) - green(b))
			break
		case 'blue':
			colors.sort((a, b) => blue(a) - blue(b))
			break
		case 'saturation':
			colors.sort((a, b) => saturation(a) - saturation(b))
			break
		case 'brightness':
			colors.sort((a, b) => brightness(a) - brightness(b))
			break
		case 'lightness':
			colors.sort((a, b) => lightness(a) - lightness(b))
			break
		default:
			break
	}
}
more examples:
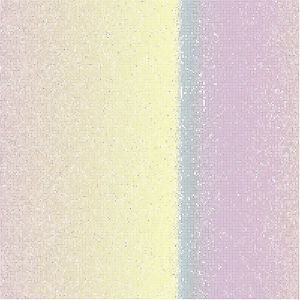
sort by saturation (left), lightness (right)
sort by two factors
colors.sort((a, b) => {
	if (abs(hue(a) - hue(b)) < 10) {
		return lightness(a) - lightness(b)
	} else {
		return hue(a) - hue(b)
	}
})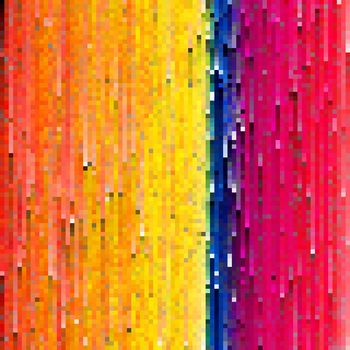
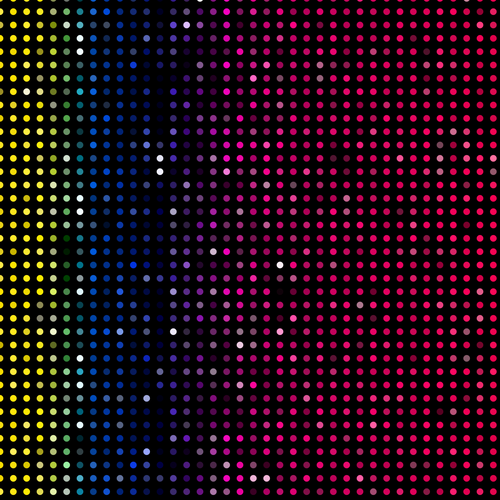
different image - sort by saturation